
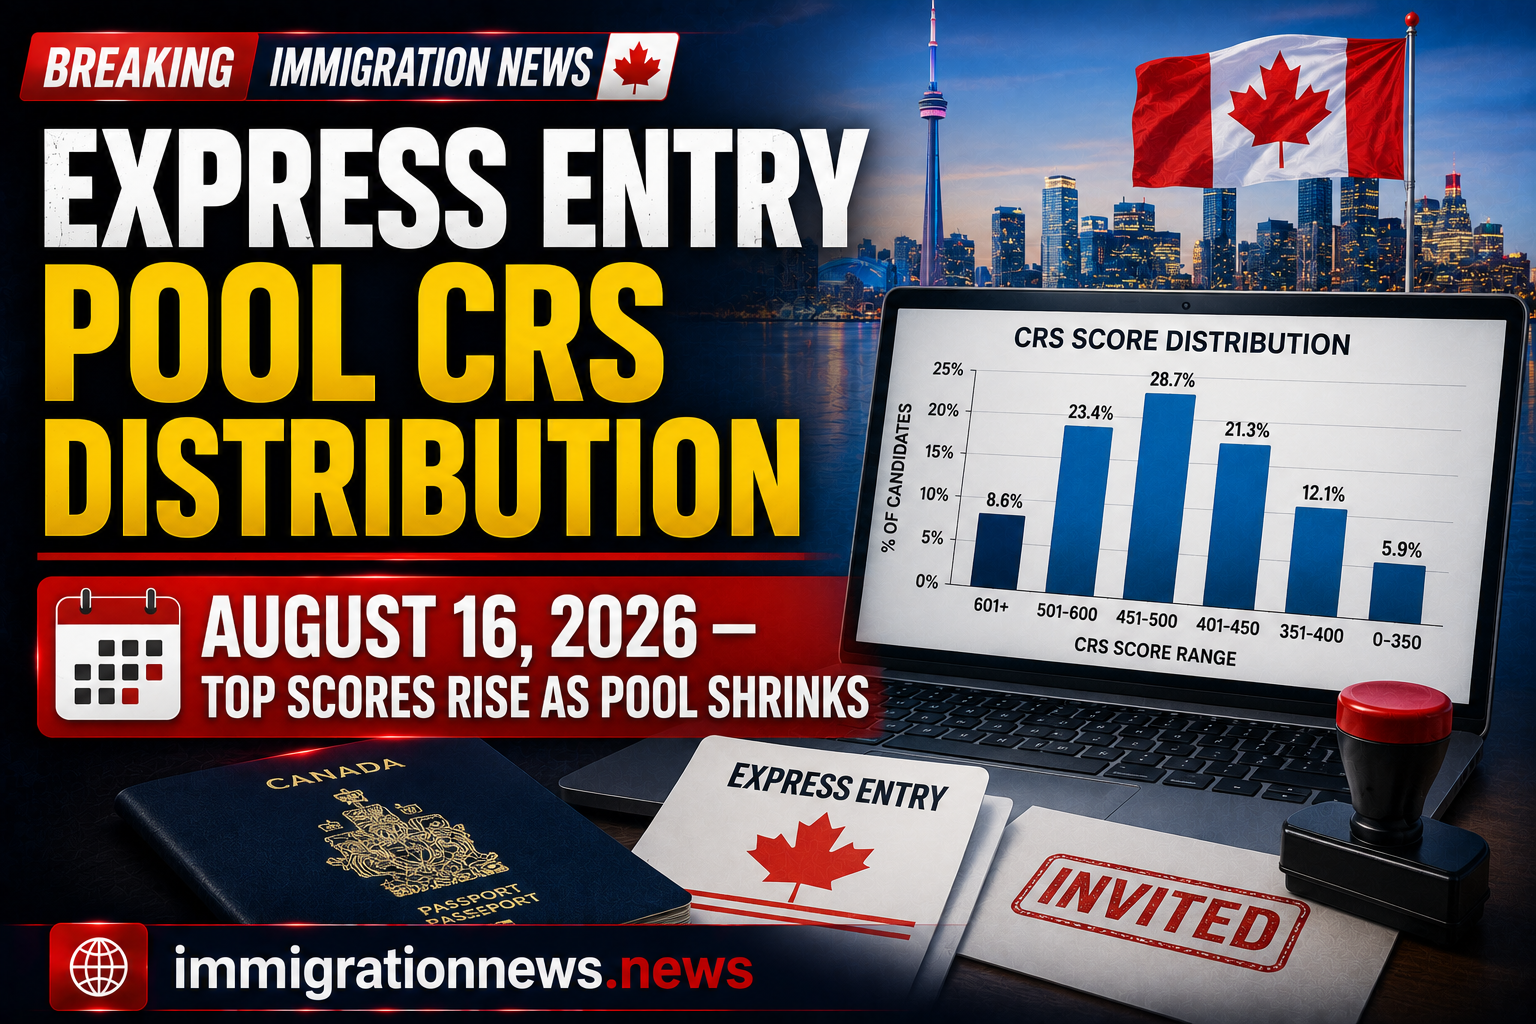
Canada’s immigration department has released updated figures showing meaningful shifts within the federal candidate pool. The Express Entry pool CRS distribution August 16 shows a total decrease of over 2,200 candidates compared to the previous update on August 3, driven largely by declines in the 351–400 and 501–600 score bands—even as the number of top-scoring profiles actually increased during the same period.
According to the latest figures published by Immigration, Refugees and Citizenship Canada, this Express Entry pool CRS distribution August 16 offers candidates their clearest picture yet of exactly where competition stands across every score range in the system.
Quick Highlights : Express Entry Pool CRS Distribution August 16
- The Express Entry pool CRS distribution August 16 shows the pool shrinking from 229,100 to 226,859 candidates
- Top-scoring profiles (601–1,200 CRS) actually fell slightly, but the broader 501–600 band declined by 1,048
- The 351–400 range saw the largest single decline, dropping by 1,507 candidates
- IRCC issued 8,807 invitations across four draws between August 3 and August 16
- A new Transport Occupations category made its debut, issuing 300 invitations at a CRS cutoff of 470
- IRCC’s total 2026 invitations reached 113,865, with 42.4% going to Canadian Experience Class candidates
- A separate August 17 PNP draw, issuing 442 invitations at CRS 760, is not yet reflected in this snapshot
Full Comparison: August 3 vs. August 16
The table below shows the complete breakdown of how candidate numbers shifted across every CRS score band during this two-week window.
| CRS Score Range | August 16 | August 3 | Difference |
|---|---|---|---|
| 0–300 | 7,709 | 7,683 | +26 |
| 301–350 | 17,269 | 17,101 | +168 |
| 351–400 | 48,600 | 50,107 | −1,507 |
| 401–410 | 10,688 | 10,775 | −87 |
| 411–420 | 11,269 | 11,326 | −57 |
| 421–430 | 11,890 | 11,942 | −52 |
| 431–440 | 13,229 | 13,267 | −38 |
| 441–450 | 13,555 | 13,595 | −40 |
| 451–460 | 14,814 | 14,845 | −31 |
| 461–470 | 16,133 | 16,057 | +76 |
| 471–480 | 16,626 | 16,368 | +258 |
| 481–490 | 13,066 | 12,890 | +176 |
| 491–500 | 12,915 | 12,939 | −24 |
| 501–600 | 18,657 | 19,705 | −1,048 |
| 601–1,200 | 439 | 500 | −61 |
| Total | 226,859 | 229,100 | −2,241 |
This Express Entry pool CRS distribution August 16 reveals a striking pattern: the largest declines occurred at both the 351–400 band and the 501–600 band, while several mid-range brackets—particularly 461–480—actually grew, suggesting a genuine reshuffling of candidates across the pool rather than uniform depletion.
Despite the pool’s overall contraction, the number of genuinely top-scoring profiles told a more nuanced story. IRCC’s own reporting noted that top-scoring profiles increased from 19,096 to 20,205 during this period—a figure that reflects a slightly different aggregation than the raw 501+ bands shown above, likely incorporating additional context from IRCC’s underlying data methodology.
Percentile Breakdown: Where You Stand
Beyond raw candidate counts, understanding percentile position offers a clearer sense of relative competitiveness within the Express Entry pool CRS distribution August 16. The following table shows the cumulative percentage of candidates at or below each score range’s upper limit.
| CRS Score Range | Candidates | Cumulative | Percentile Range |
|---|---|---|---|
| 0–300 | 7,709 | 7,709 | 0.00%–3.40% |
| 301–350 | 17,269 | 24,978 | 3.40%–11.01% |
| 351–400 | 48,600 | 73,578 | 11.01%–32.43% |
| 401–410 | 10,688 | 84,266 | 32.43%–37.14% |
| 411–420 | 11,269 | 95,535 | 37.14%–42.11% |
| 421–430 | 11,890 | 107,425 | 42.11%–47.35% |
| 431–440 | 13,229 | 120,654 | 47.35%–53.18% |
| 441–450 | 13,555 | 134,209 | 53.18%–59.16% |
| 451–460 | 14,814 | 149,023 | 59.16%–65.69% |
| 461–470 | 16,133 | 165,156 | 65.69%–72.80% |
| 471–480 | 16,626 | 181,782 | 72.80%–80.13% |
| 481–490 | 13,066 | 194,848 | 80.13%–85.89% |
| 491–500 | 12,915 | 207,763 | 85.89%–91.58% |
| 501–600 | 18,657 | 226,420 | 91.58%–99.81% |
| 601–1,200 | 439 | 226,859 | 99.81%–100.00% |
This percentile view of the Express Entry pool CRS distribution August 16 shows that a candidate scoring above 500 sits within the top 8.42% of the entire pool, while a score above 600 places a candidate in the extremely rare top 0.19%—a group almost entirely composed of provincial nominees benefiting from the 600-point CRS boost.
What Drove These Changes: The Draws Behind the Numbers
The shifts visible in this Express Entry pool CRS distribution August 16 are directly explained by IRCC’s draw activity during the two-week window. The department conducted four separate rounds, cumulatively issuing 8,807 invitations.
| Draw Date | Round Type | Invitations Issued | CRS of Lowest-Ranked Candidate |
|---|---|---|---|
| August 4 | Provincial Nominee Program | 507 | 768 |
| August 5 | Canadian Experience Class | 3,000 | 516 |
| August 6 | French-Language Proficiency | 5,000 | 391 |
| August 7 | Transport Occupations | 300 | 470 |
Notably, the August 7 round marked IRCC’s first-ever invitations issued under its revamped Transport Occupations category, following its reintroduction in February 2026 with a refreshed list of eligible occupations. This debut draw issued 300 invitations at a CRS cutoff of 470, adding a genuinely new dimension to this year’s category-based selection activity and directly contributing to some of the mid-range shifts visible in the Express Entry pool CRS distribution August 16.
A Draw Not Yet Reflected in This Snapshot
It’s important to note that the Express Entry pool CRS distribution August 16 does not account for a subsequent draw conducted the very next day. On August 17, IRCC issued 442 invitations to provincial nominees at a CRS cutoff of 760. Once IRCC publishes its next pool update, candidates should expect this draw’s effects to show up specifically within the 601–1,200 and 501–600 bands, given that it targeted exclusively high-scoring PNP candidates.
As of this August 17 draw, IRCC’s total 2026 invitations reached 113,865, with 42.4% of all invitations issued this year going to Canadian Experience Class candidates—confirming CEC’s continued position as the single largest driver of Express Entry selection volume in 2026.
How Express Entry Selection Actually Works
Express Entry is the federal government’s flagship system for managing permanent residence applications from skilled workers seeking to settle in Canada outside Quebec. To enter the pool reflected in this Express Entry pool CRS distribution August 16, a foreign national must qualify for at least one of three economic immigration programs: the Canadian Experience Class, the Federal Skilled Worker Program, or the Federal Skilled Trades Program.
Candidate profiles are ranked according to their CRS score, built from points awarded for age, education, official language ability, and work experience. Beyond general draws, IRCC also uses category-based selection (CBS) to target candidates whose qualifications align with specific economic or labour market needs. CBS draws tend to carry significantly lower cutoff scores than other draw types—illustrated clearly this year by healthcare and social services draws ranging from 467 to 475, compared to CEC cutoffs ranging from 507 to 518.
As of this writing, there are 10 distinct Express Entry categories, including French-language proficiency and occupation-based categories spanning healthcare and social services, trades, education, and the newly reintroduced transport category.
What This Means for Candidates
Candidates evaluating their position within this Express Entry pool CRS distribution August 16 should recognize that scores below 400 place them within roughly the bottom third of the entire pool, meaning general draws are unlikely to reach that range without a category-specific advantage or provincial nomination.
Those in the 401 to 480 range, which saw modest but meaningful movement during this period—including growth in several sub-bands—should recognize they’re competing within a genuinely dynamic segment of the pool. Improving CRS through updated language test results, additional education credentials, or the new Transport Occupations category (for eligible candidates) can meaningfully shift position within this range.
Selected candidates from the pool must apply for permanent residence within 60 days of receiving an invitation. Express Entry applications have historically processed in around six months, while base PNP applications have taken roughly 12 to 20 months over the past year. Approved applicants ultimately receive a Confirmation of Permanent Residence, after which they complete the landing process and obtain permanent resident status.
Key Takeaways On Express Entry Pool CRS Distribution August 16
The latest Express Entry pool CRS distribution August 16 confirms that IRCC’s active August draw schedule—including the debut of the revamped Transport Occupations category—has meaningfully reshaped candidate distribution across the pool, even as overall size contracted by more than 2,200 profiles. With a subsequent high-scoring PNP draw on August 17 not yet reflected in this data, candidates should expect further changes in the next published update. Monitoring these distribution shifts regularly remains one of the most useful ways for candidates to gauge their realistic chances in upcoming rounds.
FAQs : Express Entry Pool CRS Distribution August 16
What is the Express Entry pool CRS distribution August 16?
It is IRCC’s published breakdown of how many candidates fall within each Comprehensive Ranking System score band in the Express Entry pool, showing a decline from 229,100 to 226,859 candidates since August 3.
Why did the pool shrink despite top scores increasing?
Four draws between August 3 and 16 issued 8,807 invitations, removing candidates primarily from the 351–400 and 501–600 bands, while several mid-range bands between 461 and 490 actually grew.
What was new about the August 7 draw?
It marked the first-ever invitation round under IRCC’s revamped Transport Occupations category, reintroduced in February 2026 with a refreshed list of eligible occupations, issuing 300 invitations at CRS 470.
Does the August 16 snapshot include the August 17 PNP draw?
No. The August 17 draw, which issued 442 invitations at a CRS cutoff of 760, is not reflected in this dataset and will appear in the next published update.
What percentile does a CRS score of 500 fall into?
According to the August 16 data, a CRS score of 500 places a candidate at approximately the 91.58th percentile, ranking higher than roughly 92% of all candidates in the pool.
Source : CIC News
Read About : Newfoundland and Labrador Provincial Immigration Draw Invites 208 Candidates




One thought on “Express Entry Pool CRS Distribution August 16: Top Scores Rise As Pool Shrinks”